
Efficiency Mapping a Motor: Method and What It Reveals
Introduction
Two motors with the same nameplate power can differ by more than 10 points of real efficiency once you load them. One peaks at 94% near its rated point, the other barely reaches 84% there and falls off fast at low speed. The nameplate hides this. A motor efficiency map shows it, point by point, across the whole operating range.
This article explains how to build that map on a test bench. You will see what you need to measure, the step-by-step method, and what the finished map tells you about a motor. The goal is a practical workflow you can repeat, not a theory lecture.
What a Motor Efficiency Map Is
A motor efficiency map is a contour plot of efficiency on the torque-speed plane. Speed runs along one axis, torque along the other, and the colored bands or lines show the efficiency at each operating point. Think of it like a topographic map, where the peak is the most efficient zone and the slopes show where efficiency drops.
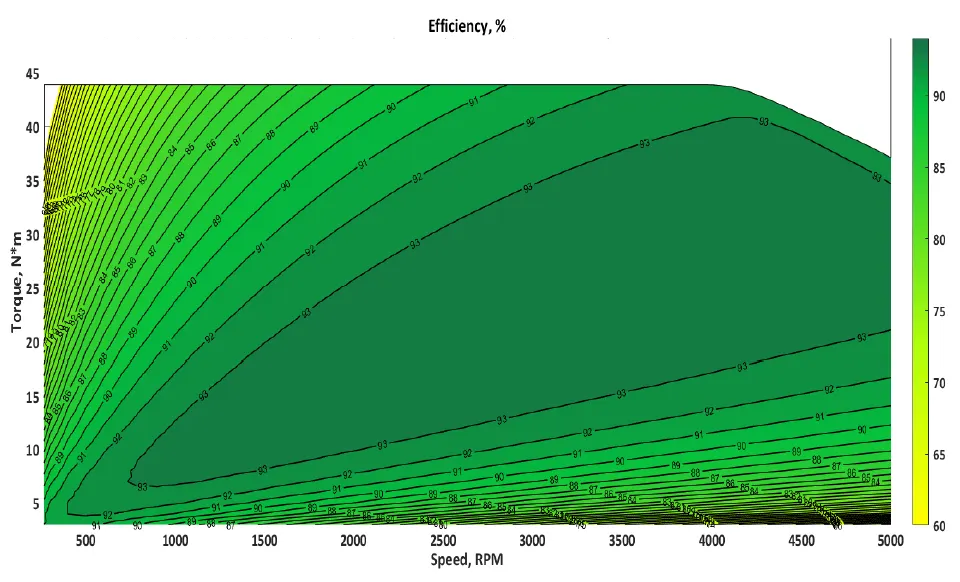
You read it by picking a duty point. Find the speed and torque your application runs at, then read the efficiency band under that point. A motor that is 92% efficient at its rated point can still drop to 70% in a corner of the map where your duty cycle actually spends most of its time. That mismatch is why the map matters more than a single headline number. For the testing setup behind it, see our overview of the electric motor test bench.
Takeaway: the map turns one efficiency number into a full picture across speed and torque.
What You Need to Measure It
Bench, Dyno and Sensors
To map efficiency you need to load the motor in a controlled way and measure both sides of the energy flow. The core hardware is a dynamometer to apply load, a torquemeter and an encoder for the mechanical side, and accurate current and voltage sensing for the electrical side.
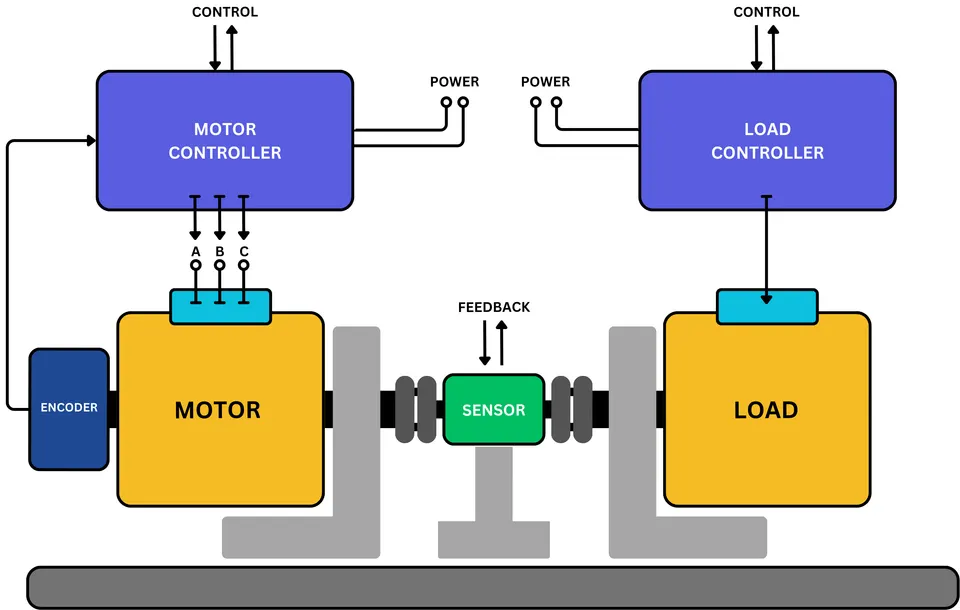
The dyno sets the load torque while you hold a target speed, so you can park the motor at any point on the grid. The torque sensor reads the shaft torque, and the encoder reads the speed. An active dyno, built from a second motor, can both absorb and drive, which helps you reach every corner of the map. A brake-type dyno absorbs only, which is fine for many points but limits four-quadrant work.
Electrical Input vs Mechanical Output Power
Efficiency is simple in form: mechanical output power divided by electrical input power.
- Electrical input power comes from the DC bus or the AC line into the drive. Measure bus voltage and bus current, and multiply. If you measure at the motor phases instead, account for the phase currents and voltages properly.
- Mechanical output power comes from the shaft. It equals torque times angular speed. With torque in newton-meters and speed in radians per second, the product is watts directly.
The accuracy of the map is only as good as these four channels: voltage, current, torque, and speed. A torque sensor sized for 50 Nm will read a 0.5 Nm point poorly, so match the sensor range to the smallest torque you plan to test, not just the largest.
Takeaway: you measure four signals, then compute output over input at every point.
The Method: Building the Map Step by Step
Defining the Torque-Speed Grid
Start by choosing the operating points you will sample. Lay a grid over the torque-speed plane: a set of speeds, and at each speed a set of torque levels up to the motor’s limit. A common starting grid is 8 to 12 speed steps by 6 to 10 torque steps, which gives a usable map without an endless test.
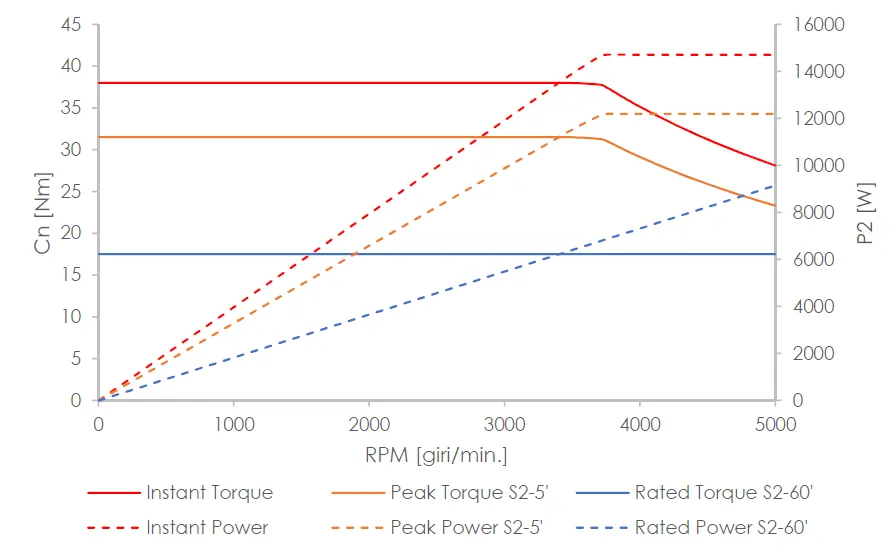
Resolution is a trade-off against time. More points give a smoother map but each point takes minutes to stabilize, so a fine grid can turn into an overnight run. As a rule, use a coarser grid first to find the interesting zones, then add points only where the efficiency changes fast.
Holding a Steady-State Operating Point
Each point must be measured at steady state, not during a transient. Command the target speed and load torque, then wait for two things to settle: the mechanical operating point, and the thermal state. Winding temperature changes resistance, which changes losses, so a cold reading and a hot reading at the same point can differ.
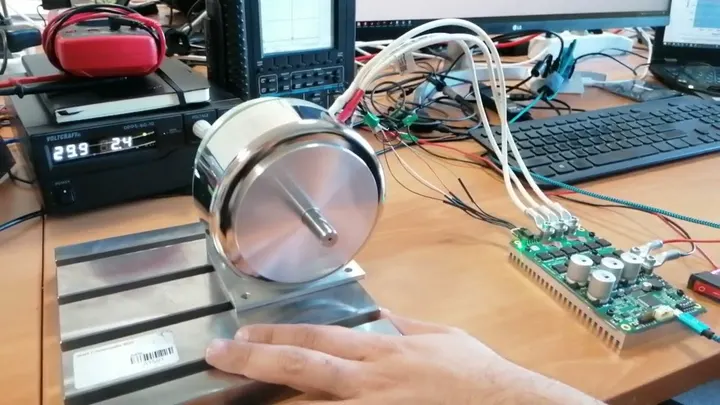
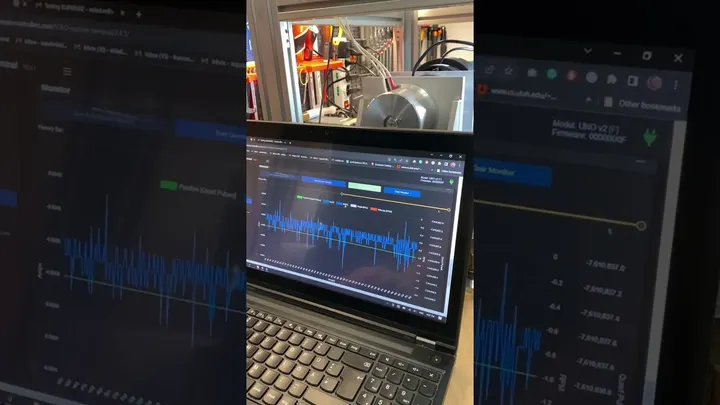
In practice you set the point, watch torque and speed hold steady, then watch temperature stop climbing. Only then do you log. For motors that heat fast, you may need to define a fixed dwell time or a target temperature so every point is measured under the same condition. The video below shows torque testing on a frameless motor, where holding a clean operating point is the whole game.
Logging and Computing Efficiency
At each settled point, log all four channels together: bus voltage, bus current, shaft torque, and speed, plus temperature for context. Average over a short window, a few seconds, to reject noise. Then compute electrical input power, mechanical output power, and their ratio for that point.
Repeat across the grid, and you get a table of efficiency values on the torque-speed plane. Finally, interpolate between the measured points to draw smooth contour bands. Most analysis tools do this for you, but the quality of the contours still depends on having enough real points in the zones that matter.
Takeaway: settle, log four channels, compute the ratio, then interpolate into contours.
What the Efficiency Map Reveals
The Sweet Spot and the Edges
The first thing the map shows is the sweet spot, the zone of highest efficiency. For most PMSM and BLDC motors this sits at moderate to high speed and mid torque, often above 90%. If your application’s duty point lands inside that zone, the motor is well matched. If it lands outside, you are paying in heat and energy for the wrong sizing.
The edges tell the rest of the story. Efficiency drops at low speed and high torque, where copper losses dominate because current is high but mechanical power is low. It also drops at very high speed, where iron losses and switching losses grow. A motor can look great on the nameplate yet spend its real life in a low-efficiency corner.
Thermal and Field-Weakening Behavior
The map also exposes how the motor behaves as it heats and as it spins past base speed. Above base speed, the drive may enter field weakening, where it injects negative d-axis current to reach higher speed at the cost of available torque. That extra current adds loss, so the high-speed end of the map usually shows lower efficiency.
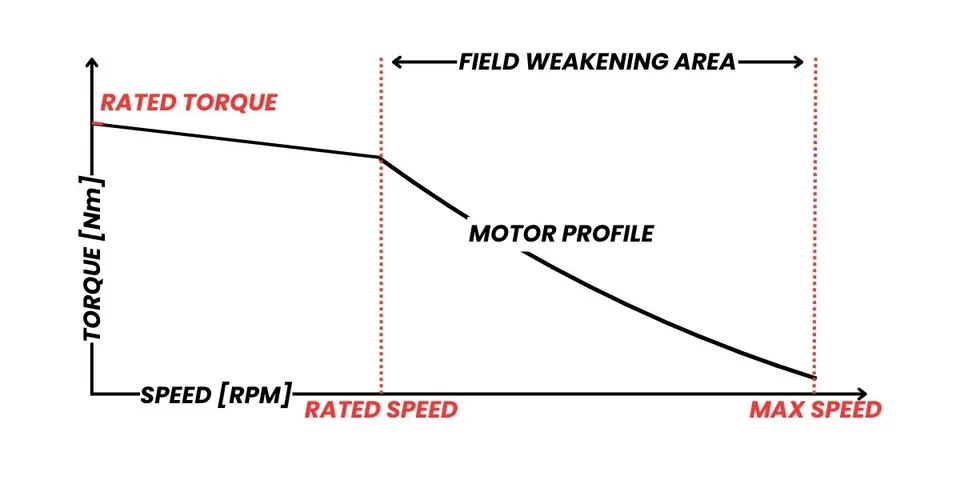
Temperature shifts the whole map. As windings warm, resistance rises and the high-torque region loses efficiency. This is why the thermal state must be controlled during the test, and why a map measured cold can mislead. The video below shows field weakening on a KM125 motor, where this high-speed trade-off is visible in the data.
Takeaway: the map reveals the best zone, the lossy corners, and how heat and field weakening reshape both.
From a Map to a Proprietary Test Report
A single efficiency map is one snapshot. The real value comes when you turn maps into repeatable characterization reports you can reuse across motors, batches, and design revisions. Once the method is fixed, the same grid and the same logging produce comparable maps every time, so you can spot a regression or compare two designs on the same scale.
That repeatability is what separates a one-off measurement from a test program. With a consistent bench, a fixed grid, and controlled thermal conditions, each map becomes a documented data point about a specific motor under known conditions. A capable bench can generate these reports automatically from the logged runs, so the map is not just a picture but a record you can file, share, and trust later.
How SOLO Supports Efficiency Mapping
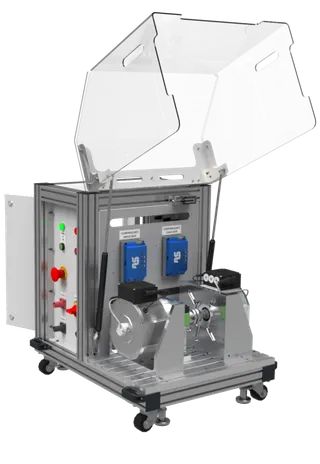
At SOLO we build motor test benches that support efficiency mapping end to end, from loading the motor to logging the data and computing the map. The benches use an active or brake dyno to set the operating point, a torquemeter and encoder for the mechanical side, and integrated electrical measurement for input power, so all four channels arrive in one place.
The control software can step through a torque-speed grid, hold each point, wait for thermal settle, and log every channel automatically. That removes most of the manual work and helps keep every point measured under the same conditions. The benches cover DC, BLDC, PMSM, and AC induction motors on the same setup. You can see the current SOLO motor test bench and tell us the motors you need to characterize.
Conclusion
An efficiency map turns a single nameplate number into a full picture of how a motor performs across speed and torque. To build one, you load the motor on a dyno, measure torque, speed, voltage, and current at each point of a torque-speed grid, hold each point at steady state, then compute output power over input power and interpolate the contours. The finished map shows the efficient sweet spot, the lossy corners at low speed and high speed, and how heat and field weakening reshape both. If you want to map your own motors, the SOLO motor test bench is a good next step, and our team can match the bench to your motors.
FAQ
What equipment do I need to map a motor’s efficiency?
You need a dynamometer to load the motor, a torque sensor and an encoder for the mechanical side, and accurate voltage and current measurement for the electrical side. Logging software ties the channels together so you can compute efficiency at each point. The torque sensor range should match your smallest torque, not just your largest.
How many operating points should an efficiency map have?
A practical starting grid is around 8 to 12 speed steps by 6 to 10 torque steps, which gives a usable map without a very long test. Add more points only in the zones where efficiency changes fast. More points give smoother contours but each one needs time to settle, so a fine grid can become an overnight run.
Why does motor efficiency drop at low speed and high torque?
At low speed and high torque the current is high but the mechanical power is low, so copper losses, which grow with current squared, dominate. The motor burns energy as heat in the windings while producing little useful output power, so efficiency falls. This is why the low-speed, high-torque corner of the map is usually one of the least efficient zones.
Can the same bench map BLDC, PMSM and induction motors?
Yes, if the controller and dyno support all of them. A bench built on a multi-mode controller can load and measure DC, BLDC, PMSM, and AC induction motors without swapping the core hardware. The measurement method, output power over input power across a torque-speed grid, is the same for every motor type.
Tags:EfficiencyMotor TestingTest Bench
Products in this article
Related articles

Drone Motor Testing: Thrust and Efficiency Bench
How to test drone motors and propellers for thrust and efficiency: bench setup, thrust/torque sensing, and reading the data that matters for UAVs.

In-House Motor Testing ROI: When a Test Bench Pays Off
When does an in-house motor test bench pay for itself versus outsourcing? A simple ROI and payback model for motor testing.

Motor Test Bench Cost: What Drives the Price
What a motor test bench costs and why: power range, dyno type, sensors, automation and safety. A transparent breakdown of what moves the price.
